Problem
The analysis and processing of surveys are part of the activities carried out by sociologists. In this example, we are interested in the development of an automated system for processing surveys. This system will produce "conventional" statistical results in this field: frequency distribution, bivariate frequency tables, various counting... The basic data used in this example come from a survey carried out in 1993-1994 among 258 students in the first year of DEUG (ordinary diploma) in sociology. The original survey included 55 questions.
The system to be developed should incorporate the following elements:
- Representation and storage of quantitative and qualitative variables.
- Representation storage and processing of questions with multiple replies.
- Control of the number of theoretical (possible) and authorized (one or more) responses for each question.
Data dictionary
| Mnemonic | Wording |
| Age | Age of the individual (total years) |
| Cdrep | Code of the answer of an individual to a given question. |
| Fratrie | Description of the numerical code representing a person's response to a question. |
| Lbquest | Wording of the sex of the individual : Male or Female |
| Lbreponse | Description of the numerical code representing a person's response to a question. |
| Lbsexe | Gender description: Male or Female. |
| Nbrep_aut | How many answers are permitted for a specific question. |
| Nbrep_th | Number of theoretical answers to a specified question. |
| Numchoix | The person's number choice for multiple answers (always 1 if the question is only one answer) |
| Numind | Number of the individual |
| Numquest | Number of the question |
| Sexe | Gender code of the person (1 or 2) |
| TypeQ | Type of Question (Q: Qualitative, N: Quantitative) |
Data Diagram
For more information on the different steps of the data diagram construction refer, in these pages, to the column DB Design.
1-Simple FDs
Individu -> Sexe, Age, Fratrie, Lbsexe
Sexe -> Lbsexe
Numquest -> Lbquest, Nbrep_th, Nbrep_aut, TypeQ
2-Unclassified attributes and compound FDs.
The attributes Cdrep, Lbreponse and Numchoix were not classified in the previous step, they occur in FDs compounds which are:
Numquest, Numchoix, Numind -> Cdrep, Sexe, Age, Fratrie, Lbsexe, Lbquest, Nbrep_th, Nbrep_aut, TypeQ
Numquest, Cdrep -> Lbreponse, Lbquest, Nbrep_th, Nbrep_aut, TypeQ
3-Eliminating transitivity.
Individu -> Sexe, Age, Fratrie
Sexe -> Lbsexe
Numquest -> Lbquest, Nbrep_th, Nbrep_aut, TypeQ
Numquest, Numchoix, Numind -> Cdrep
Numquest, Cdrep -> Lbreponse
4-Building of entities and associations.
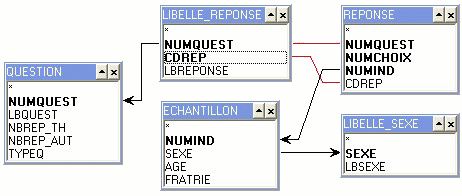
ECHANTILLON(Numind, Sexe, Age, Fratrie)
LIBELLE_SEXE(Sexe, Lbsexe)
QUESTION(Numquest, Lbquest, Nbrep_th, Nbrep_aut, TypeQ)
REPONSE(Numquest, Numchoix, Numind, Cdrep)
LIBELLE_REPONSE(Numquest, Cdrep, Lbreponse)
5-Connecting entities and associations.
| Source entity | Goal entity | Relation on attribute | Type of relation |
| ECHANTILLON | LIBELLE_SEXE | Sexe | 1-m |
| ECHANTILLON | REPONSE | Numind | 1-m |
| QUESTION | LIBELLE_REPONSE | Numquest | 1-m |
| QUESTION | REPONSE | Numquest | 1-m |
| REPONSE | LIBELLE_REPONSE | Numquest | m-m |
| REPONSE | LIBELLE_REPONSE | Cdrep | m-m |
The last two connections on the previous table (m-m) are not, like the other connections, integrity constraints. They simply specify the attributes of the joint to be used to link tables REPONSE and LIBELLE_REPONSE.
6-Diagram of data
The "optimal" data structure is as follows (keys are highlighted):

Queries
For simplicity, the database used in the following questions is composed solely of a subset of source data.
To visualize the contents of each table of the database, type:
SELECT * FROM Name_of_the_table;
within a frame containing the button "Execute".
Note to English Readers: The value of a string attribute must be written in French. To view the actual content of attributes, use the command above.
Indicate how many people responded to the same survey: 1 in question 1, 2 in question 2 and 3 in question 3. (Answer)
Display which is (on average), the number of brothers and sisters of an individual according to the profession of the father of that individual. We will assume that the father's profession is question number three in the survey. (Answer)
Calculate the frequency distribution for question 2 divided by gender. (Answer)
Make a bi-variable frequency table between questions 2 and 4. (Answer)
Display the population's distribution by sex and age. (Answer)
Display the distribution, by gender and number of questions, for those who did not answer a question: the wording of the answer is equal to ‘Non-response'. (Answer)