Building the data diagram.
The final step is to link the entities and associations found in the previous step in order to build the global data structure: the data diagram.
------------------------------------
The schema obtained by this method is the conceptual data diagram.
------------------------------------
Linking entities
Entities are linked through their common attributes. The types of relation permitted between two entities (associations) fall into the following two categories:
- 1-1 relation: to an element of the start set, only a single element of the goal set can be matched and vice versa.
- 1-m relation: for one element of the starting set, it is possible to match several elements of the goal set.
------------------------------------
By applying the method, the relationships between entities and associations can only be of the m-1 type, so functional dependencies. The objective of this step is to determine the functional dependencies between entities and associations: construction of the index graph.
------------------------------------
To determine the relations between entities (associations), it is thus necessary to examine the number of occurrences (cardinal) of each entity involves in the relation.
In our example, we have the following relations:
| Source entity | Goal entity | Relation on attribute | Type of relation |
| SEXE | ETUDIANT | Cdsexe | 1-m |
| ETUDIANT | NOTES | Numetu | 1-m |
| MATIERE | NOTES | Numat | 1-m |
| ENSEIGNANT | MATIERE | Numens | 1-m |
If we look at the first line above, we see that the relation between SEXE and ETUDIANT is of type 1-m.
Indeed, in the entity SEXE, a particular value of the attribute Cdsexe (H or F) will be present, only once (1). On the other hand, in the entity ETUDIANT, the same value of attribute Cdsexe may be present several times (m), as many times as there are students of this gender.
So, we have the following entities:
ETUDIANT(Numetu, Nometu, Dtnaiss, Cdsexe)
ENSEIGNANT(Numens, Nomens, Grade, Ancien)
MATIERE(Numat, Nomat, Coeff, Numens)
SEXE(Cdsexe, Lbsexe)
NOTES(Numetu, Numat, Note)
The Data Diagram
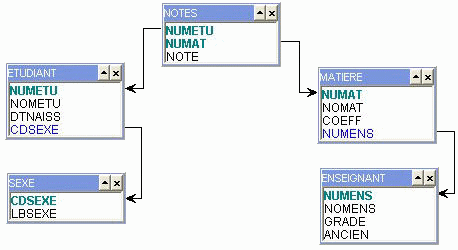
To obtain a synthetic view of the structure of the database (the data diagram), we use a figure of the following type:

This representation is the diagram of the "STUDENTS" database. This is the optimal data structure for our problem: maximum coherence and minimal redundancy.
A major point for the "purists"
------------------------------------
The above diagram is the conceptual data diagram, not the logical data diagram. Indeed, m-1 relations represent the functional dependencies between entities and relationships. The above diagram should therefore be considered as a picture of the functional dependency graph. In fact, it is the minimal coverage of the graph.
With this method, the building of the logical, then the physical diagram is obvious:
Logical diagram: Functional dependencies between entities and relationships become referential integrity constraints.
Physical diagram: Every entity/relationship become a table
------------------------------------